Checking stimulus time-lock quality
One very important consideration when using an evoked-response Brain Computer Interface (ERP-BCI) is ensuring an accurate time-lock between the stimuli and the measured EEG. As a minimum this time-lock needs to be accurate enough to unambiguously identify which stimulus a brain response comes from. Thus, for example if we are using a 60Hz display to present stimuli, this means a new stimulus can happen very 1/60s = 16ms, so to ensure we can identify which brain response corresponds to which stimulus we require a time-lock accuracy between the display and the measured EEG of <16ms.
This tutorial shows you how to run an hardware test of your BCI design to objectively measure the time-lock precision quality. By the end of this tutorial you will be able to: * use an opto-resistor to directly link your stimulus presentation system to your EEG measurment system * run a test BCI run to get data to check the time-lock quality * generate visualizations of the time-lock quality data which show: the general trigger check quality, the single-trial stimulus->trigger connection in time, and the trigger response model used by the BCI * interpert the results of this trigger check quality plot to check if the quality is sufficient
Introduction
So how do you ensure you have a sufficient time-lock quality? One approach is to ‘just-try-it’ with a brain. If you are lucky this will ‘just-work’ – in which case you can conclude that your timing was probably sufficiently good. However, what if it doesn’t work? Then you do cannot tell where the problem was, was it the cap-fitting, a stimulus bug, a decoder bug, or a poor time-lock.
To avoid these types of situations it is better to debug, and measure the time-lock in isolation.
We are specifically concerned with the time-lock quality between: 1. the stimulus generated by our presentation software on some hardware stimulus device (most likely a screen) and 2. the EEG measured from some hardware acquisition device by our decoder
Thus, to do an effective time-lock we need to: * Run the stimulus presentation system * Run the decoder and acquisition device * Add a hardware very low latency connection between the stimulus and acquisition system to inject stimulus signals into the acquisition device * Run some additional analysis to measure and visualize the timing accuracy
This tutorial walks through how to do such a measurement for a visual-presentation system using an opto-resistor to couple the stimulus to the EEG system.
To do this test you will need: 1. A visual stimulus presentation system. 2. A supported EEG measurement system. Here we will use the openBCI cyton, but the same technique should work for any EEG device. 3. An opto-resistor connecting the screen to the amplifier. 4. This notebook to run the trigger-check script, which generates trigger checking results
The main steps in performing the test are: 1. Connect the opto-resistor to the display 2. Run your BCI test. 3. Analyse the gathered results. (Though this can also be done on-line while the BCI is running.)
Step 1: Connect the opto-resistor to the display
You can find the instructions for building an opto-resistor and connecting it to the EEG amplifier here.
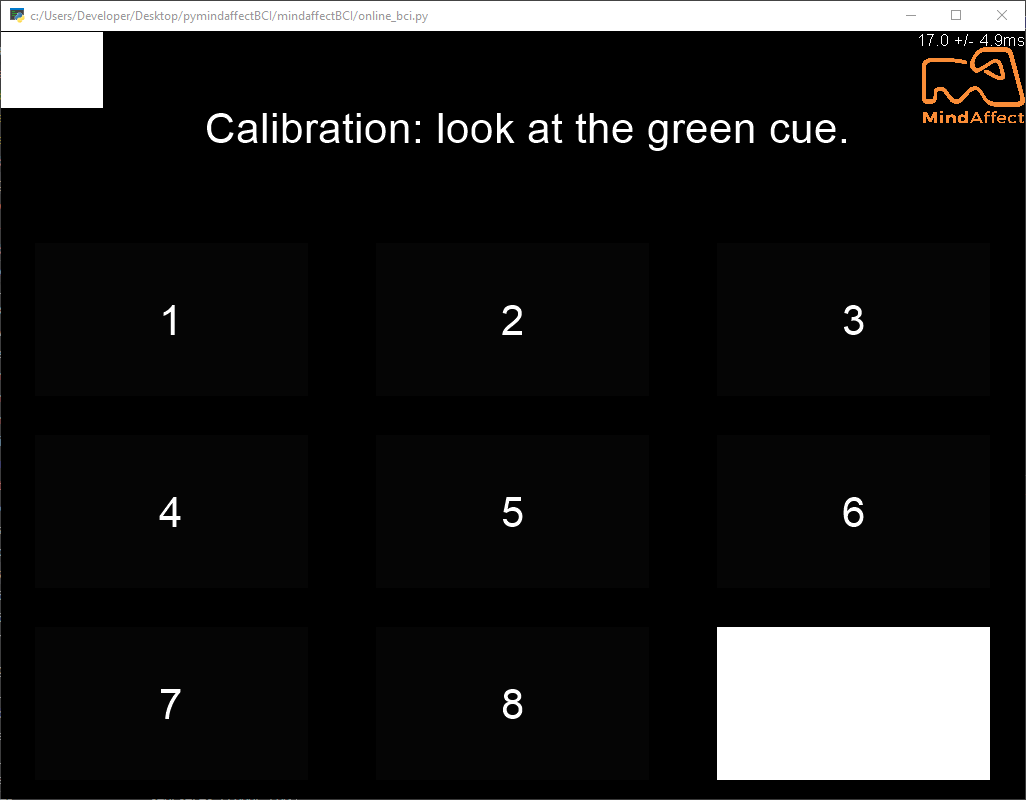
Note: to use the opto-sensor for time-lock quality, the opto-sensor must measure the target stimulus.
That is the button which is cued green during calibration or cued feedback. To make this easier in our default
there is a special ‘opto-sensor’ location at the top-left of the screen (see below) which always shows a copy of the target stimulus – so you can simply fix the opto-resistor at that location.
Step 2: Run your BCI test run
After connecting the display to the amplifier. The next stage is to run the BCI with the opto-resistor connected to get the timing data. As we want to test the whole on-line processing loop we do this by simply running the full BCI stack, where basically the opto-resistor replaces the brain with a ‘perfect’ response brain.
To run the BCI we will use the online_bci.py script with the trigger_check.json configuration file.
Note: if you do not have the EEG or opto-resistor hardware, you can simulate this run by using the acquisition='fakedata' option, which will use the fake-data EEG simulator, which also include a software trigger injector.
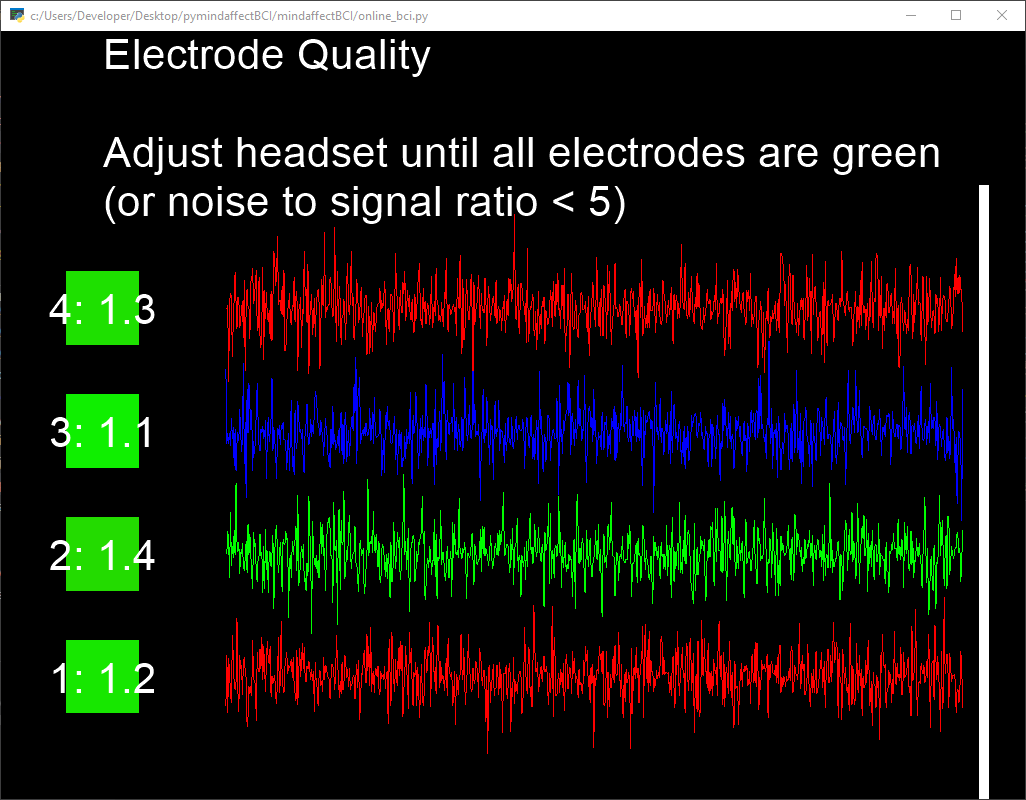
After the BCI has started: * Press 0 to go to the signal viewer. Here you can quickly check if your opto-resistor is working correctly by changing the display brightness and looking for the change in the appropriate EEG channel.
- Press a key to exit the signal viewer.
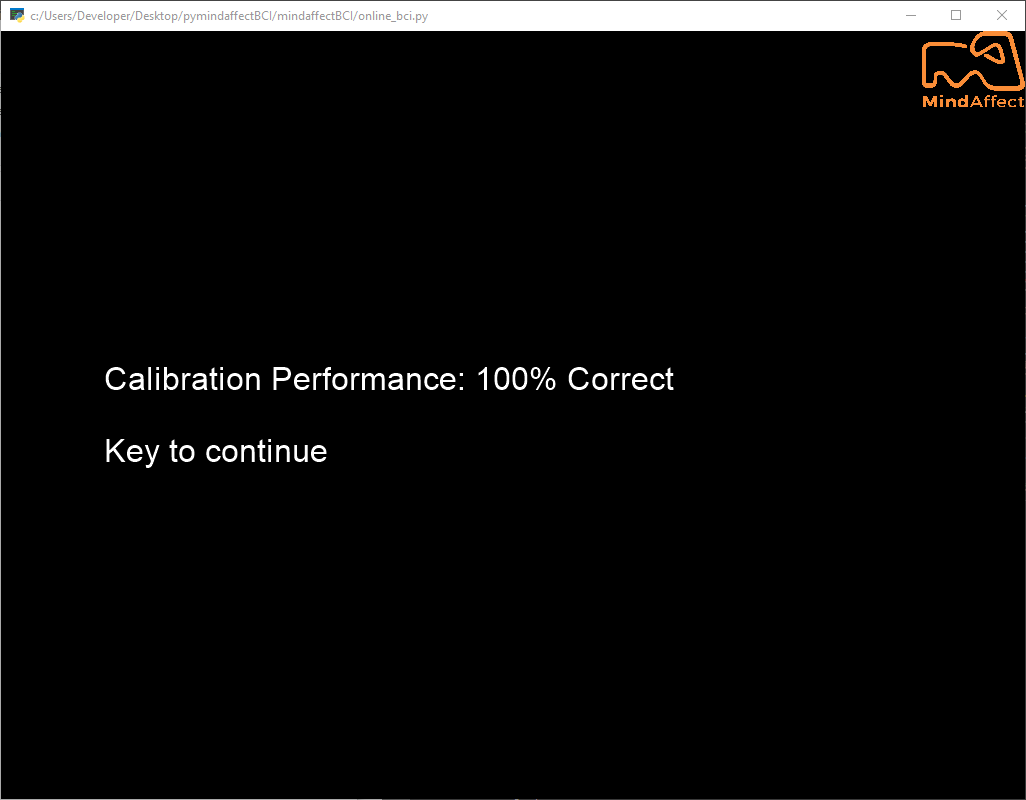
- Press 1 to enter cued calibration. The system will now do 10 calibration trials of 4.2s each, and then fit the BCI model. If your opto-resistor (and the BCI) is working correctly, it should tell you the calibration performance was 100%.
- Press a key to return to the main menu. You can now press 2 to enter cued prediction if you wish, and test the trained BCI model. Alternatively, as you have now got sufficient data for the time-lock analysis you can press q or escape to quit.
[ ]:
import mindaffectBCI.online_bci
# load the configuration file
config = mindaffectBCI.online_bci.load_config('trigger_check')

# for debugging with the fakedata source uncomment this line!
#config['acquisition']='fakedata'

# run with the loaded configuration
mindaffectBCI.online_bci.run(**config)
Step 3: Analyse the time-lock analysis data
If the above test ran correctly the system will have saved a data file in the logs directory of the project with a name like mindaffectBCI_YYMMDD_HHMM.txt containing all the information about your experiment. This can be used for offline-analysis to explore and refine the model fitting process as explained in the offline analysis tutorial.
Here we will just do a trigger-check analysis. For this we need to know which save file to load. Fortunately, as a convenience for this situation if we use the filename - the system will automatically load the most recent save file from the logs directory – which is the one we just generated.
When this check runs it will generate 3 plots visualizing the trigger check data:
- Trigger Check: This plot shows as an image the measured EEG response for every stimulus onset (i.e. when the stimuli gets brighter) for every trial. This is displayed as an image where the vertical axis is time since the stimulus, and the horizontal axis are the onsets within each trial, with color showing the magnitude of the EEG. This is the key plot for determining the timing accuracy.
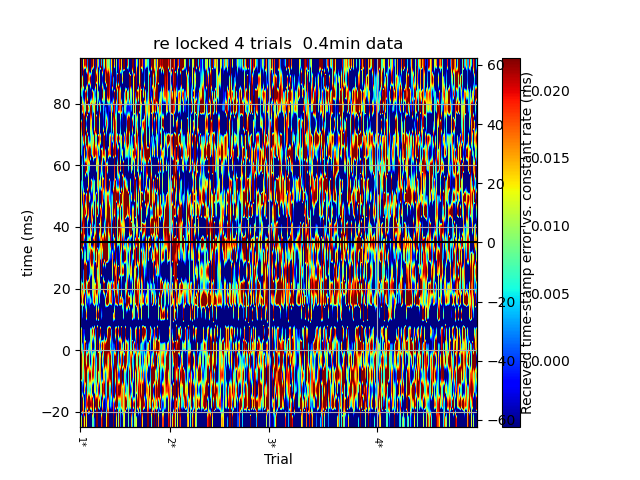
If your timing is accurate you should see a clear horizontal band at some time after 0ms – here it’s a blue line at about 10ms (in fact due to filtering artifacts you may see more than one such band). By zooming in the y-axis you should see that:
- The bands are perfectly horizontal, with no jitter. If there is timing jitter you will see the start of the band move up and down between trials. Here you can see there is a jitter of about +/-5ms – which is 1 sample as the simulated amplifier runs at 200Hz.
- The bands have no slope or steps. Slopes imply that the stimulus timing is drifting with respect to the EEG measurements. Steps imply the stimulus timing is suddenly increasing and decreasing in latency with respect to its nominal time-stamp. In particular we have noticed that steps are common for displays as the operating system (particularly windows) adds and removes frames from the graphics system to draw animations and blurs.
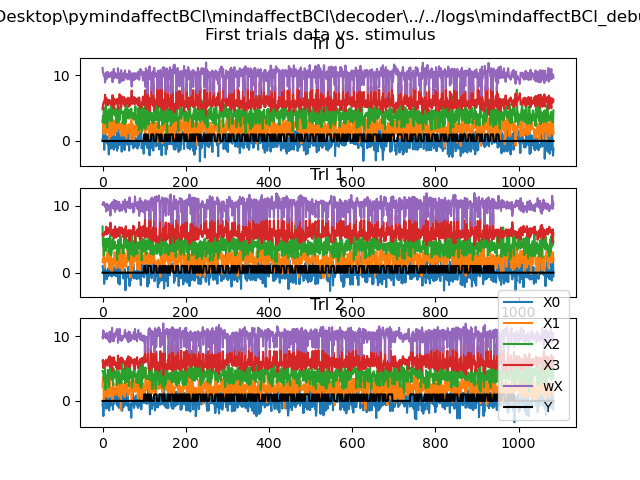
- First Trials: This plot shows the raw time series for the first 3 trials of the saved data. In addition it shows the stimulus data in
Y(black) and predicted stimulus data generated by the fitted model inwX. If your opto-resistor is working correctly you should clearly see the opto signal in the appropriate channel of X (channel 8 if using the cyton.)
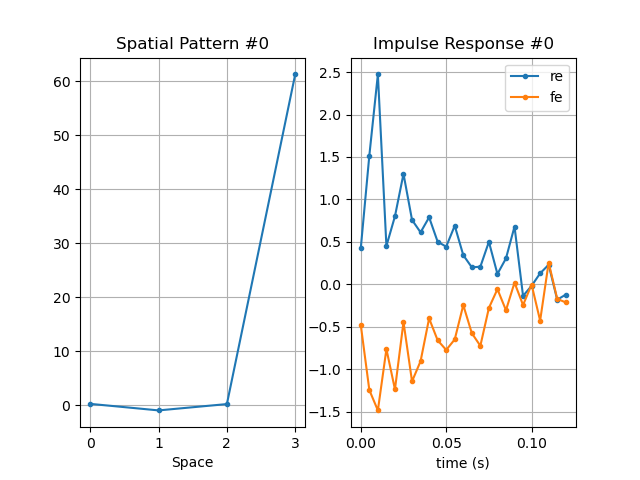
- Classifier Model. This plot shows the parameters of the model trained by the classifier to identify the trigger response. In particular the spatial pattern should match that of the opto-resistor channel if the model is correct.
[ ]:
from mindaffectBCI.decoder.trigger_check import trigger_check
trigger_check('-')